Analyzing Supermarket Sales Data: An Exploratory Data Analysis Project
With so much competition in retail these days, knowing what your sales data tells you is essential for making smart choices. Data analysis can be a game-changer, helping businesses discover hidden trends that boost sales and make customers happy. This blog post dives into a supermarket’s sales data. We’ll use SQL to analyze it and Tableau to create visuals. This project shows how to turn raw information into useful insights that can improve sales strategies and operations.
The goal of this project is to perform an exploratory data analysis (EDA) on a supermarket sales dataset derived from this Kaggle link. The dataset includes various fields such as invoice ID, branch, city, customer type, gender, product line, unit price, quantity, tax, total, date, time, payment method, cost of goods sold (COGS), gross margin percentage, gross income, and customer rating. By analyzing this data, we aim to uncover trends and patterns that can help in making strategic business decisions.
Dataset Fields
- Invoice ID: Computer-generated sales slip invoice identification number
- Branch: Branch of supercenter (A, B, C)
- City: Location of supercenters
- Customer type: Type of customers (Members, Normal)
- Gender: Gender of the customer
- Product line: General item categorization groups
- Unit price: Price of each product in $
- Quantity: Number of products purchased by the customer
- Tax 5%: 5% tax fee for customer buying
- Total: Total price including tax
- Date: Date of purchase
- Time: Purchase time
- Payment: Payment method used by the customer
- COGS: Cost of goods sold
- Gross margin percentage: Gross margin percentage
- Gross income: Gross income
- Rating: Customer stratification rating on their overall shopping experience (scale of 1 to 10)
Check Missing Values
SELECT
COUNT(*) AS Total_Records,
SUM(CASE WHEN [Invoice ID] IS NULL THEN 1 ELSE 0 END) AS Missing_InvoiceID,
SUM(CASE WHEN Branch IS NULL THEN 1 ELSE 0 END) AS Missing_Branch,
SUM(CASE WHEN City IS NULL THEN 1 ELSE 0 END) AS Missing_City,
SUM(CASE WHEN [Customer type] IS NULL THEN 1 ELSE 0 END) AS Missing_CustomerType,
SUM(CASE WHEN Gender IS NULL THEN 1 ELSE 0 END) AS Missing_Gender,
SUM(CASE WHEN [Product line] IS NULL THEN 1 ELSE 0 END) AS Missing_ProductLine,
SUM(CASE WHEN [Unit price] IS NULL THEN 1 ELSE 0 END) AS Missing_UnitPrice,
SUM(CASE WHEN Quantity IS NULL THEN 1 ELSE 0 END) AS Missing_Quantity,
SUM(CASE WHEN [Tax 5%] IS NULL THEN 1 ELSE 0 END) AS Missing_Tax5,
SUM(CASE WHEN total IS NULL THEN 1 ELSE 0 END) AS Missing_Total,
SUM(CASE WHEN date IS NULL THEN 1 ELSE 0 END) AS Missing_Date,
SUM(CASE WHEN time IS NULL THEN 1 ELSE 0 END) AS Missing_Time,
SUM(CASE WHEN Payment IS NULL THEN 1 ELSE 0 END) AS Missing_Payment,
SUM(CASE WHEN cogs IS NULL THEN 1 ELSE 0 END) AS Missing_Cogs,
SUM(CASE WHEN [gross margin percentage] IS NULL THEN 1 ELSE 0 END) AS Missing_GrossMarginPercentage,
SUM(CASE WHEN [gross income] IS NULL THEN 1 ELSE 0 END) AS Missing_GrossIncome,
SUM(CASE WHEN Rating IS NULL THEN 1 ELSE 0 END) AS Missing_Rating
FROM
[retail].[dbo].[supermarket_sales – Sheet1];
SQL Queries for Data Analysis
Using SQL, we can extract meaningful insights from the dataset. Here are some key queries and their purposes:
Total Sales Per Branch
SELECT Branch, SUM(Total) AS Total_Sales
FROM [retail].[dbo].[supermarket_sales – Sheet1]
GROUP BY Branch;
Total Sales per City
SELECT City, SUM(Total) AS Total_Sales
FROM [retail].[dbo].[supermarket_sales – Sheet1]
GROUP BY City;
Sales Breakdown by Customer Type
SELECT [Customer type], SUM(Total) AS Total_Sales
FROM [retail].[dbo].[supermarket_sales – Sheet1]
GROUP BY [Customer type];
Sales Breakdown by Gender
SELECT Gender, SUM(Total) AS Total_Sales
FROM [retail].[dbo].[supermarket_sales – Sheet1]
GROUP BY Gender;
Sales per Product Line
SELECT [Product line], SUM(Total) AS Total_Sales
FROM [retail].[dbo].[supermarket_sales – Sheet1]
GROUP BY [Product line];
Average Rating per Branch
SELECT Branch, AVG(Rating) AS Average_Rating
FROM [retail].[dbo].[supermarket_sales, – Sheet1]
GROUP BY Branch;
Average Sales per Transaction
SELECT Branch, AVG(Total) AS Average_Sales
FROM [retail].[dbo].[supermarket_sales – Sheet1]
GROUP BY Branch;
Total Quantity Sold by Product Line
SELECT [Product line], SUM(Quantity) AS Total_Quantity_Sold
FROM [retail].[dbo].[supermarket_sales – Sheet1]
GROUP BY [Product line];
Payment Method Distribution
SELECT Payment, COUNT(*) AS Number_of_Transactions, SUM(Total) AS Total_Sales
FROM [retail].[dbo].[supermarket_sales – Sheet1]
GROUP BY Payment;
Gross Income Per Product Line
SELECT [Product line], SUM([gross income]) AS Total_Gross_Income
FROM [retail].[dbo].[supermarket_sales – Sheet1]
GROUP BY [Product line];
Data Visualization
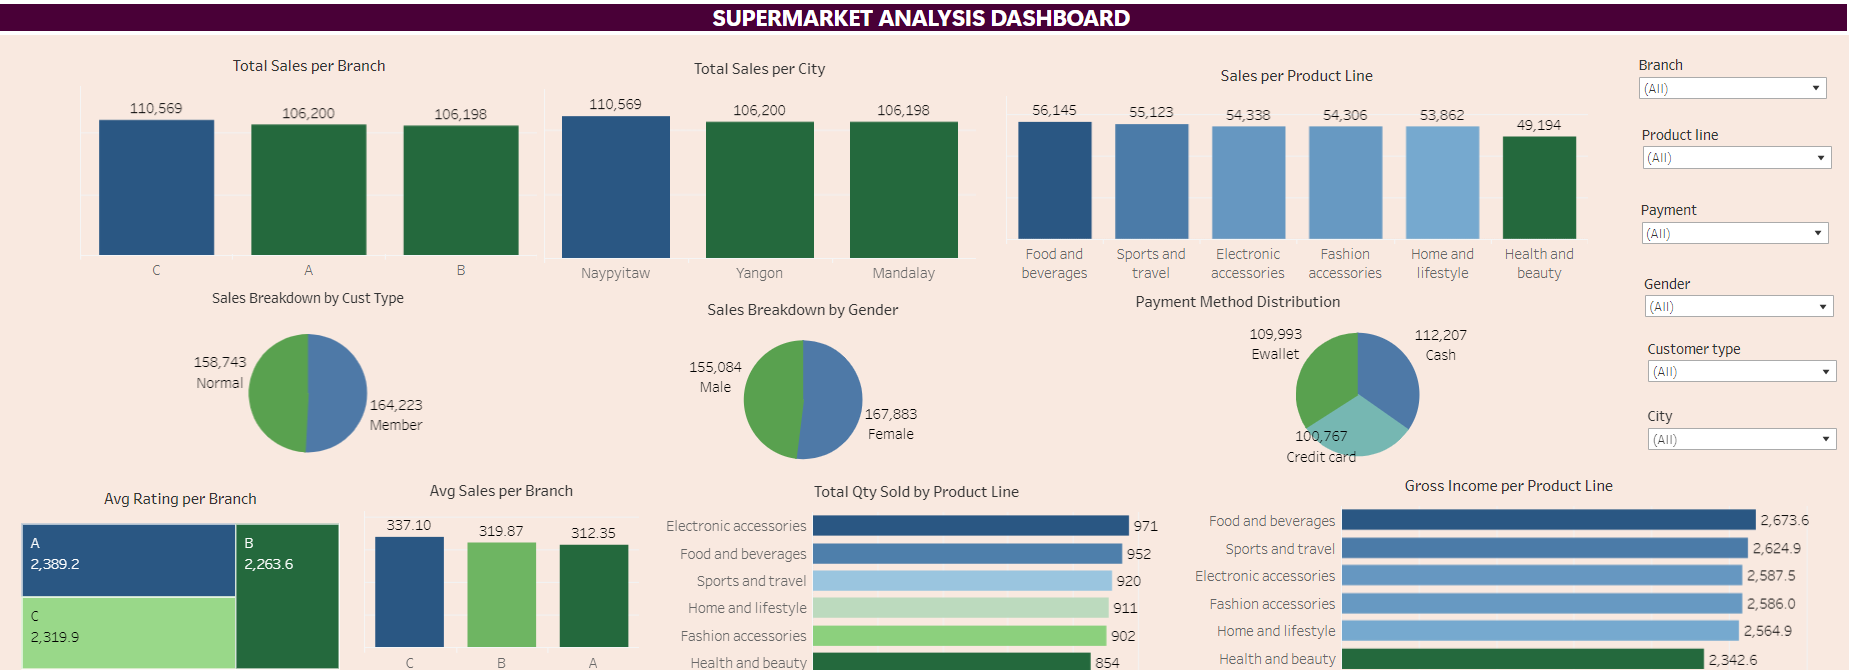
With the insights derived from the SQL queries, we can create visualizations in Tableau to present the data in an easily digestible format. Links.
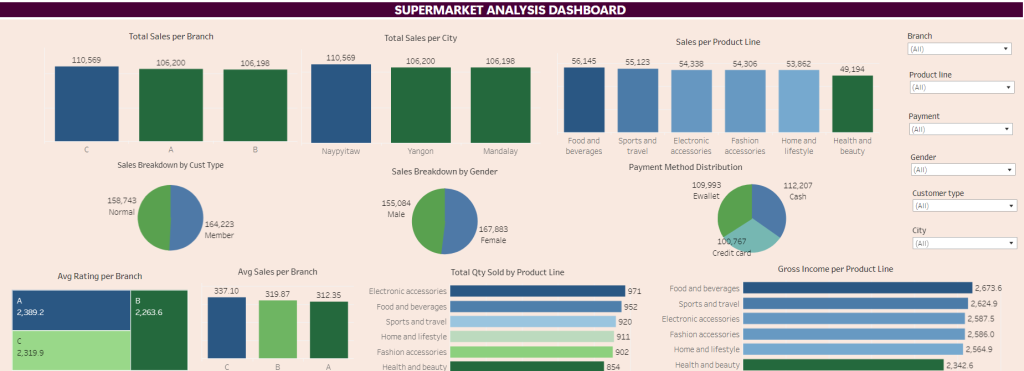
By analyzing the supermarket sales data, several key insights to conclude :
Branch Performance:
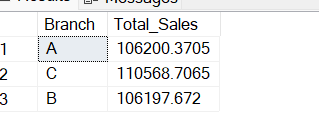
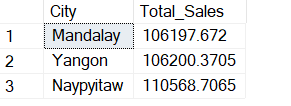
- Branch B is the top performer with total sales of $110,568, slightly outperforming Branches A and C, which have nearly identical sales of $106,200 and $106,197 respectively. This indicates a relatively balanced performance across branches, with Branch B having a slight edge.
Customer Demographics:
- Customer Type:
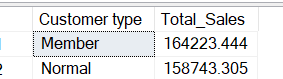
- Members contribute more to sales ($164,223) compared to Normal customers ($158,743). This suggests that loyalty programs are effective and should be continued or enhanced.
- Gender:
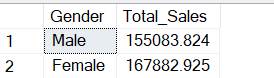
- Female customers account for higher sales ($167,882) compared to Male customers ($155,083). Marketing strategies could be tailored to further attract female shoppers.
Product Line Analysis:
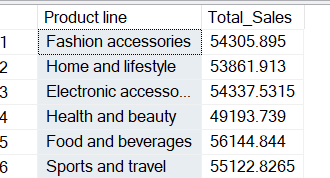
- Food and Beverages is the best-selling product line with total sales of $56,144.84, followed by Sports and Travel ($55,122.83), and Electronic Accessories ($54,337.53). This highlights the need to maintain strong inventory levels and marketing focus on these categories.
- Health and Beauty products, while still significant, have the lowest total sales ($49,193.74), suggesting an area for potential growth or re-evaluation of product offerings.
Average Sales Per Transaction:
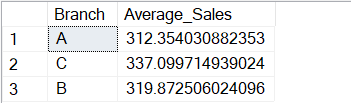
- Branch C has the highest average sales per transaction ($337.10), indicating more significant purchases per customer. This branch may have effective upselling or bundling strategies that could be implemented across other branches.
- Branch A has the lowest average sales per transaction ($312.35), suggesting an opportunity to boost sales strategies to increase the average transaction value.
Total Quantity Sold by Product Line:
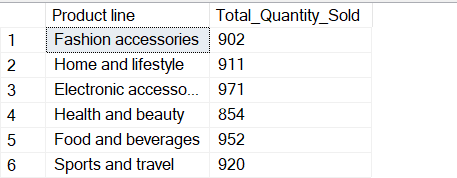
- Electronic Accessories has the highest total quantity sold (971 units), followed closely by Food and Beverages (952 units). These product lines are in high demand, and maintaining sufficient stock is crucial.
- Health and Beauty has the lowest quantity sold (854 units), indicating a potential area for marketing efforts to boost sales.
Customer Experience:
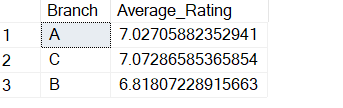
- Branch C has the highest average customer rating (7.07), followed closely by Branch A (7.03). Branch B has a slightly lower average rating (6.82), suggesting a need for service quality improvements to match customer satisfaction levels of the other branches.
Payment Preferences:
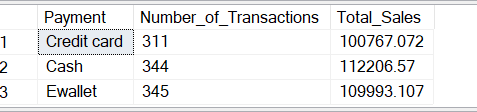
- Cash is the most preferred payment method, accounting for the highest sales ($112,206.57), followed by Ewallet ($109,993.11) and Credit Card ($100,767.07). Enhancing and promoting the convenience of cash and e-wallet payments could further improve customer satisfaction and sales.