data analysis

Analyzing Supermarket Sales Data: An Exploratory Data Analysis Project
This project explores supermarket sales data using SQL for analysis and Tableau for visualization. Key fields include invoice ID, branch, customer type, product line, unit price, quantity, tax, total, payment method, and customer rating. The goal is to uncover trends and insights to improve sales strategies and operations.
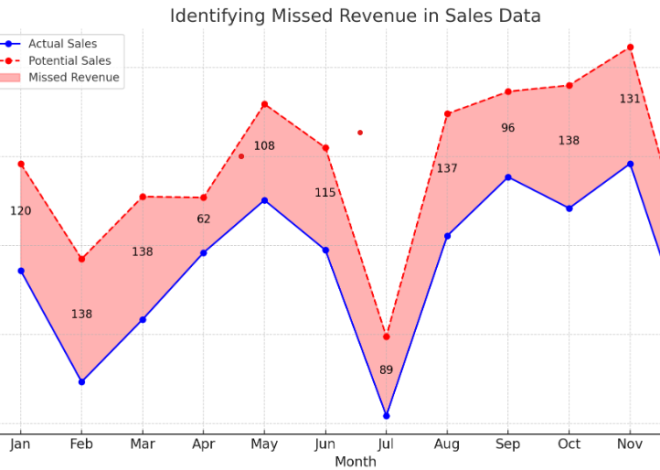
Case Study : Identifying Missed Revenue Through Data Analysis
In my previous role within sales operations in a few companies, I played a crucial role in uncovering missed revenue opportunities. By using some data analysis approaches, I was able to pinpoint discrepancies that resulted in a substantial financial impact.

Simple Web Scraping with Python : Extracting Book Details from an E-commerce Site
This project involved scraping book titles, prices, and ratings from ‘Books to Scrape’ and saving the data as a CSV file. Key steps included sending HTTP requests, parsing HTML, extracting details, and structuring the data.
Mastering Data Cleaning in Excel
Data cleaning is the process of identifying and correcting errors, inconsistencies, and inaccuracies in datasets to ensure they are accurate, reliable, and ready for analysis. It involves a series of steps, from removing duplicates and handling missing values to standardizing data formats and correcting errors.
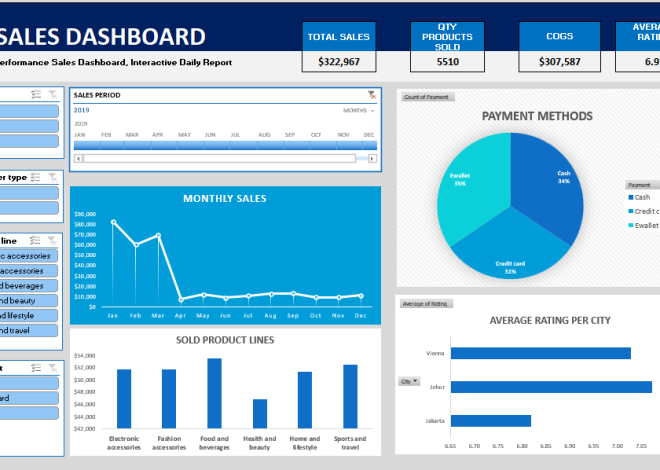
Data Discovery : Crafting Excel Sales Dashboard for Supermarket Sales
This dashboard analyzes supermarket sales data, covering sales period, amounts, product lines, city-wise ratings, and payment methods to track performance over time.

Revealing Sales Insights: SQL Project for Effective Pipeline Analysis
Building on sales data insights, this project analyzes the sales funnel using a relational database. Queries were used to examine lead sources, conversion rates, and sales team performance.
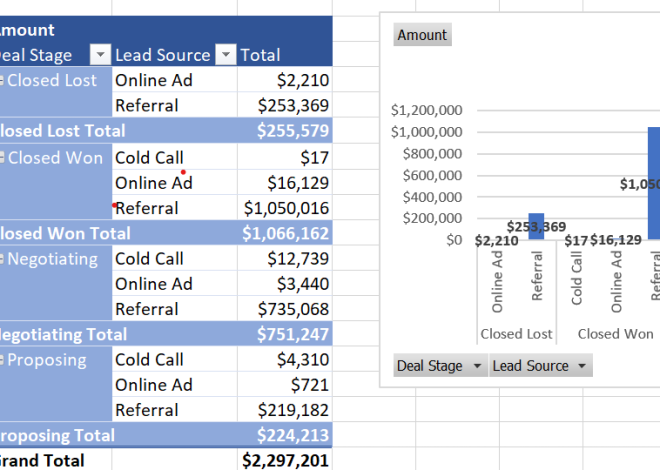
Sales Pipeline Analysis using Excel : Finding Trends and Insights
This project explores sales funnel dynamics using Excel to identify patterns, track sales progress, and visualize key performance indicators (KPIs).