Sales Pipeline Analysis using Excel : Finding Trends and Insights
Welcome to my most recent data analysis project, where I used Excel to explore the dynamics of the sales funnel. In order to obtain important insights into the sales process, my project’s objectives were to identify patterns, monitor sales progress, and depict key performance indicators (KPIs).
The Dataset
To kick off the analysis, I created a sample sales dataset, encompassing essential parameters such as Date, Lead Source, Deal Stage, and Amount. The dataset simulates a range of sales scenarios, allowing me to explore and demonstrate the capabilities of Excel for sales analytics.
Data Cleaning and Exploration
The first step involved cleaning the data to ensure accuracy and consistency. I used Excel functions to handle missing values and performed basic data exploration to understand the distribution of key variables. PivotTables were instrumental in summarizing the data by Lead Source and Deal Stage, providing a solid foundation for further analysis.
Data Cleaning in Excel :

Step 1: Identify Missing Values
- Use Conditional Formatting, Data Filter
- Finding Blank cells with Conditional Formatting, to highlight cells with missing values.
- Use the filter options to sort and identify rows with missing values.
Step 2: Handle Missing Values
2. Delete Rows:
- If a row has missing values and is not crucial for analysis, consider deleting the entire row.
- Select the row.
- Right-click and choose “Delete.”
- Fill Missing Values:
- For numerical data, you can use the
IForIFERRORfunction to replace missing values with a default value or a calculated value.- Example:
=IF(ISBLANK(A2), "Not Available", A2) - This formula checks if the cell in column A is blank. If it is, it replaces the value with “Not Available.”
- Example:
- For text data, use a similar approach with the
IFfunction.- Example:
=IF(ISBLANK(B2), "Unknown", B2) - This formula replaces a blank cell in column B with “Unknown.”
- Example:
- For numerical data, you can use the
- Use Averaging:
- If missing values are in numeric columns, consider using the AVERAGE function to fill missing values with the average of the column.
- Example:
=IF(ISBLANK(C2), AVERAGE(C:C), C2) - This formula replaces missing values in column C with the average value of the column.
- Example:
- If missing values are in numeric columns, consider using the AVERAGE function to fill missing values with the average of the column.
Step 3: Handling Inconsistent Data
5. Remove Duplicates:
- Use the “Remove Duplicates” feature in the “Data” tab to eliminate duplicate rows.
- Select the dataset.
- Go to the “Data” tab and click “Remove Duplicates.”
6. Check Data Types:
- Ensure that the data types in each column are consistent.
- Select the column.
- Right-click and choose “Format Cells” to set the appropriate data type.
7. Use Data Cleaning Functions:
- Utilize functions like
TRIMto remove leading and trailing spaces orPROPERto capitalize the first letter of words.
- Check for Consistency in Categorical Data:
- If dealing with categorical data, ensure consistency in naming conventions.
Step 4: Recheck for Missing Values
9. Reapply Conditional Formatting:
- After cleaning, reapply conditional formatting to verify that missing values are adequately handled.
These steps help you identify, handle, and clean up missing or inconsistent data in your Excel dataset. Customizing these methods based on your specific dataset and requirements will contribute to a more accurate and reliable analysis. After further check, there is no blank cells to be found in the dataset.
Data Cleaning and Exploration in Excel :
Step 1: Calculate Basic Statistics using Excel Functions
- SUBTOTAL is definitely my favorite, better than SUM (please see previous posts) :

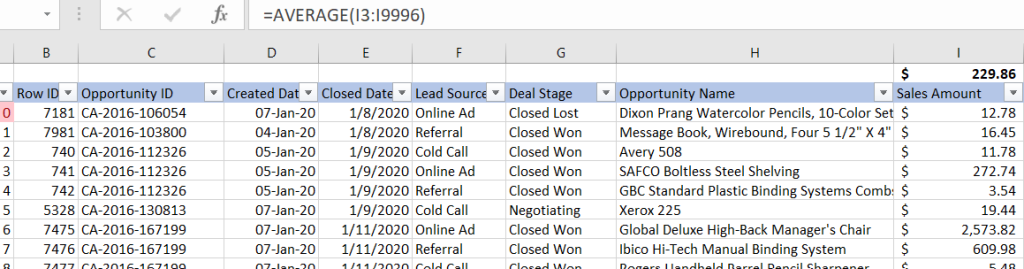
2. AVERAGE:
Calculate the average deal amount using the AVERAGE function.
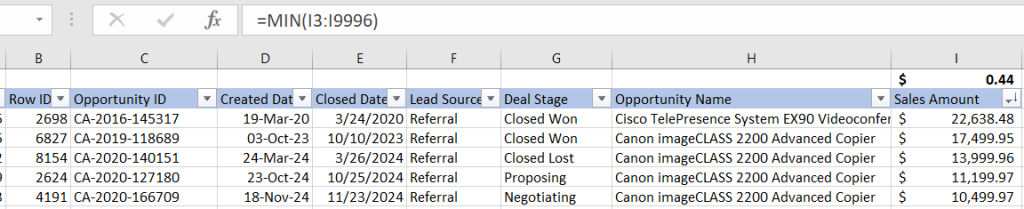
3. MIN and MAX: Find the minimum and maximum deal amounts.

Step 2: Create Pivot Tables

Step 3: Data Visualization
- Create Charts :

Bar Chart to create visual representation & compare the total sales amount by Lead Source.
12. Dynamic Charts with PivotCharts :
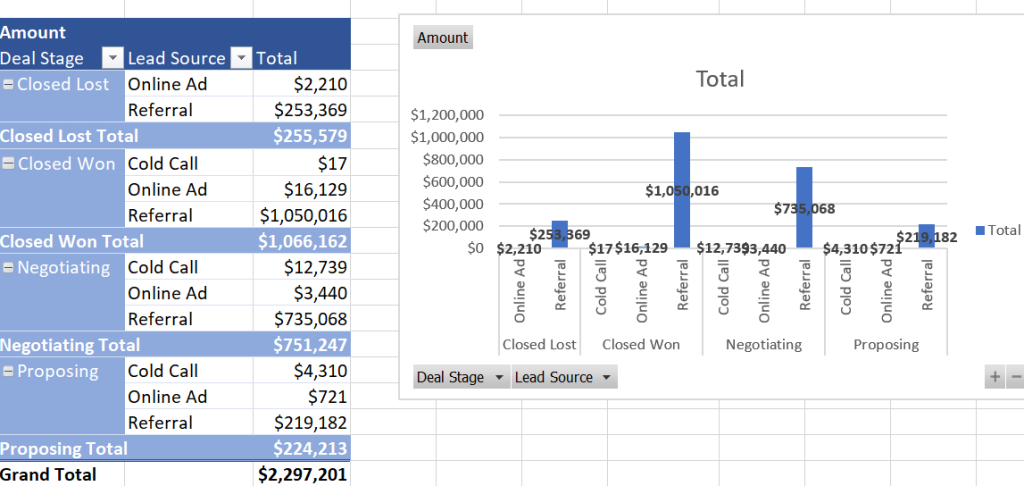
Converting PivotTable into a PivotChart for interactive and dynamic visualizations, explore different chart types based on your data and preferences.
Conclusion:
By leveraging Excel functions for basic statistics and creating PivotTables, you can quickly gain insights into your sales dataset. This process sets the foundation for deeper analysis and visualization, allowing you to uncover trends and patterns that can be valuable for making informed decisions.
Sales Pipeline Analysis
- Calculate Conversion Rates : creating new column in col H to evaluate conversion rates from Lead to Prospect.

2. Identify Lead Source Contribution

Using Pivot table, Referral still contributes as the main sales contribution.
3. Identify Highest Conversion Rate per Stage

With Referral as Lead Source, Lead stage pipelines remains with highest conversion rates.


Summary of Findings:
1. Lead Source Contribution :
- Key Insight: The lead source “Referral” significantly contributes to successful deals in the sales pipeline.
- Implication: Understanding the impact of referral sources on successful deals provides valuable information for strategic marketing and lead generation efforts.
2. Conversion Rates by Stage :
- Key Insight: The “Lead” stage demonstrates the highest conversion rates among all stages in the sales pipeline.
- Implication: The efficiency observed in the “Lead” stage indicates a strong potential for optimization and scaling. Further analysis and enhancement of lead qualification processes could yield even better results.
Recommendations for Sales Process Optimization:
1. Leverage Referral Sources:
- Action Item: Focus on nurturing and expanding referral channels.
- Rationale: Given the significant contribution of referrals to successful deals, allocating resources to enhance relationships with existing referrers and exploring opportunities for new referrals can be a strategic move.
2. Optimize Lead Stage Processes:
- Action Item: Conduct a detailed review and optimization of processes within the “Lead” stage.
- Rationale: With the highest conversion rates observed in the “Lead” stage, streamlining and improving lead qualification, communication, and follow-up processes can potentially accelerate deals through the pipeline.
3. Implement Data-Driven Marketing Strategies:
- Action Item: Utilize data insights to refine marketing strategies.
- Rationale: The analysis highlights the importance of data-driven decision-making. By continually analyzing and adjusting marketing strategies based on lead source performance, marketing efforts can be more targeted and effective.
4. Continuous Monitoring and Iteration:
- Action Item: Establish a system for continuous monitoring and iteration.
- Rationale: The sales pipeline is dynamic, and its efficiency is subject to change. Implementing a system for ongoing monitoring and iterative improvements ensures that the sales process remains optimized and aligned with evolving market conditions.
Key Performance Indicators (KPIs) and Visualization
With the sales pipeline stages laid out, I calculated crucial KPIs such as win rate, average deal size, and sales cycle length. Excel’s charting tools came in handy to visualize these KPIs, providing clear graphical representations of trends and patterns. Bar charts, pie charts, and line charts were employed to convey information intuitively.
- Win Rate : Calculate the win rate for each stage by dividing the number of won deals by the total number of deals in that stage.

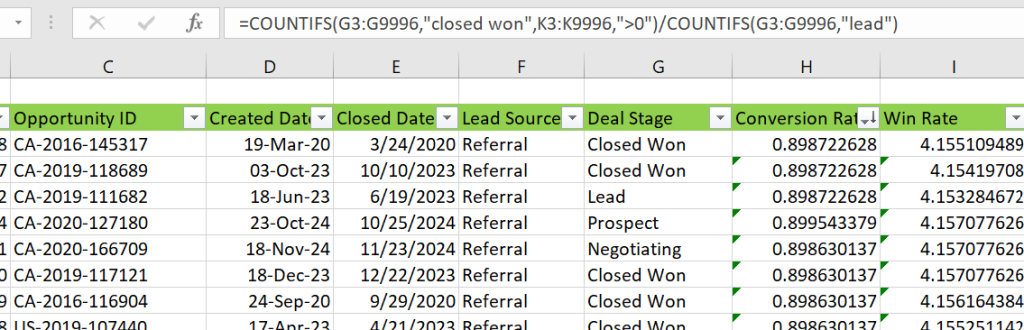
2. Average Deal Size : Calculate the average deal size for each stage.


Win rates for each stage : Prospect stage holds the highest win rate. (Bar chart).

Insights and Recommendations
1. Prospect Stage:
- Insight: The analysis revealed that the “Prospect” stage demonstrates the highest win rate among all stages in the sales pipeline.
- Implication: The “Prospect” stage is particularly effective in converting deals into successful outcomes.
2. Referral Leads Source:
- Insight: The analysis identified that leads from the “Referral” source exhibit the highest conversion rates in the sales pipeline.
- Implication: Referrals play a crucial role in generating successful deals, showcasing the significance of leveraging and expanding referral channels.
Recommendations:
1. Optimize Prospect Stage Processes:
- Action Item: Conduct a detailed review and optimization of processes within the “Prospect” stage.
- Rationale: Given the high win rate at the “Prospect” stage, further enhancing and streamlining processes in this stage can potentially lead to even more successful outcomes.
2. Leverage Referral Sources:
- Action Item: Strengthen efforts to nurture and expand referral channels.
- Rationale: As referrals contribute significantly to successful conversions, allocating resources to enhance relationships with existing referrers and exploring opportunities for new referrals can be a strategic move.
3. Implement Targeted Marketing for Referral Sources:
- Action Item: Implement targeted marketing strategies for the “Referral” lead source.
- Rationale: Given the high conversion rates from referrals, developing specific marketing campaigns and incentives to encourage referrals can further capitalize on this effective lead source.
4. Continuous Monitoring and Adjustment:
- Action Item: Establish a system for continuous monitoring and adjustment of sales processes.
- Rationale: The sales pipeline is dynamic, and its efficiency is subject to change. Implementing a system for ongoing monitoring and iterative improvements ensures that the sales process remains optimized and aligned with evolving market conditions.
Conclusion:
The findings underscore the importance of understanding and capitalizing on the strengths within the sales pipeline. By focusing on optimizing the “Prospect” stage and leveraging the effectiveness of the “Referral” lead source, the sales team can enhance overall performance and increase the likelihood of successful conversions. The actionable recommendations provide a strategic roadmap for immediate improvements and sustained success in the sales process.