Revealing Sales Insights: SQL Project for Effective Pipeline Analysis
Armed with the insights we gained from our SQL project’s analysis of sales data, we can now embark on a thorough examination of the sales funnel.
Project Overview: The project involved creating a relational database with tables representing deals and customers. By querying this database, I aimed to answer critical questions about lead sources, conversion rates, and sales team performance.
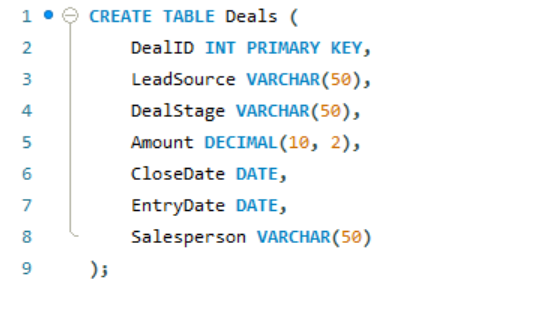
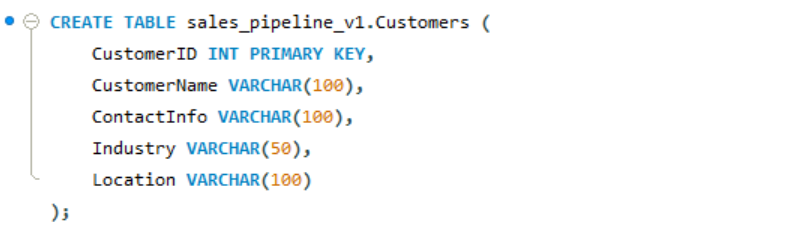
Database Structure : Create 2 tables for “Deals” and “Customers”
1. Conversion Rates: One of the primary objectives was to calculate conversion rates between different deal stages. SQL queries allowed me to precisely determine how leads progressed through the pipeline. For instance, calculating the conversion rate from “Lead” to “Prospect” provided insights into the efficiency of lead qualification processes.
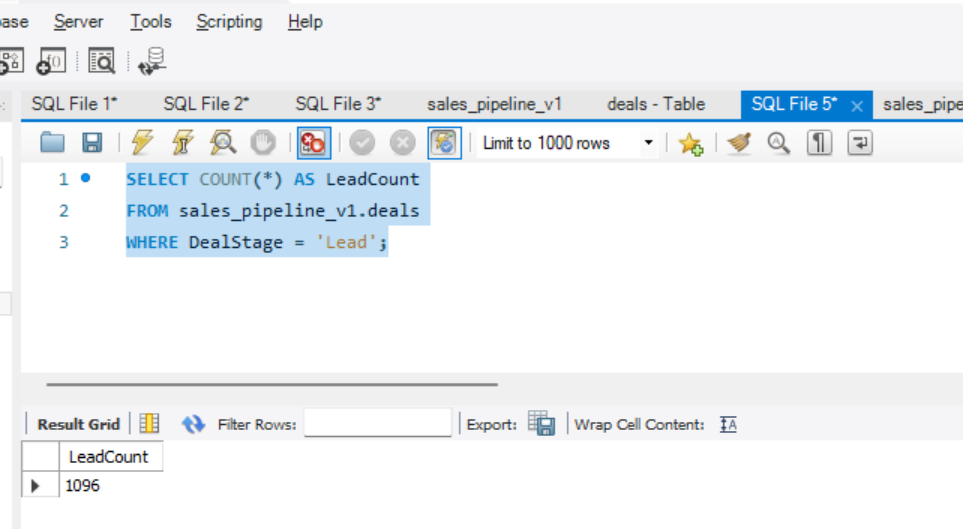
Count the Number of Deals in Each Stage : in this case, we’re going to count deals in “Lead” Stage
Count the Number of Deals in the Target Stage : target stage is to be “Prospect” stage.
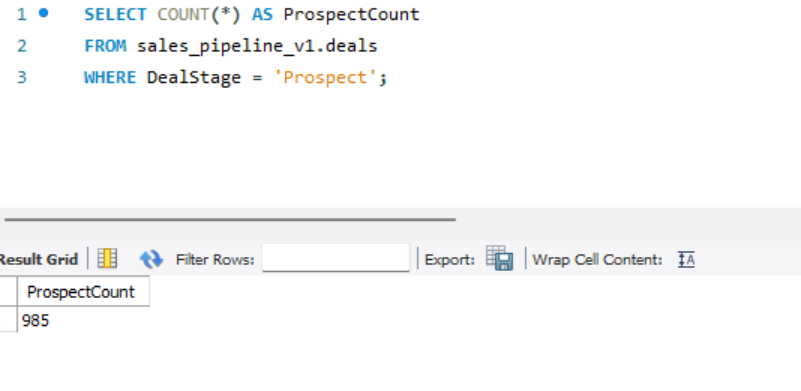
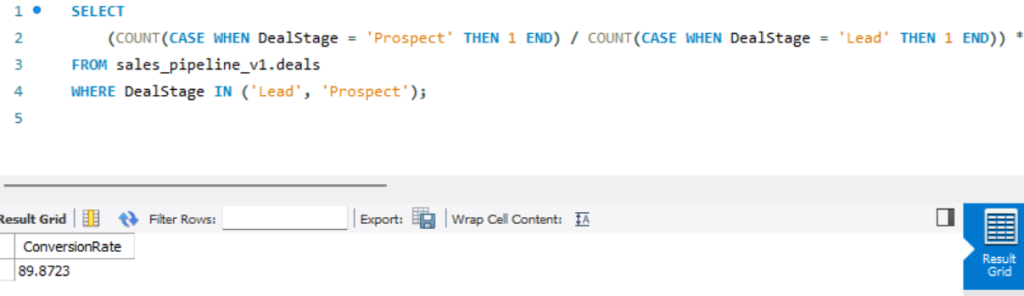
Calculate Conversion Rate : The formula for conversion rate is (Number of deals in the target stage / Number of deals in the source stage) * 100. You can extend the query to calculate conversion rates between any two stages :
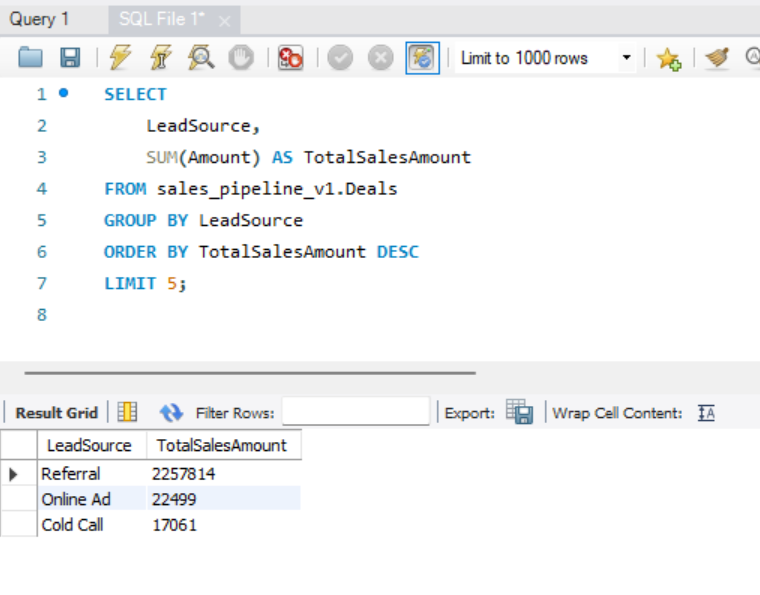
2. Top Lead Sources: Identifying the lead sources contributing the most to successful deals was another key focus. Utilizing SQL’s aggregation capabilities, I could pinpoint the top lead sources based on total sales amounts. This knowledge is invaluable for directing marketing efforts effectively.
This query selects the lead source and calculates the total sales amount for each lead source from the Deals table. It then groups the results by lead source, orders them in descending order based on total sales amounts, and limits the result to the top 5 lead sources (in this table, there are only 3 lead sources).
3. Sales Team Performance: Analyzing the performance of the sales team was an essential aspect. SQL queries provided a detailed breakdown of each salesperson’s contribution, including the total number of deals closed and the cumulative sales amount. This information aids in recognizing top-performing team members and areas for improvement.
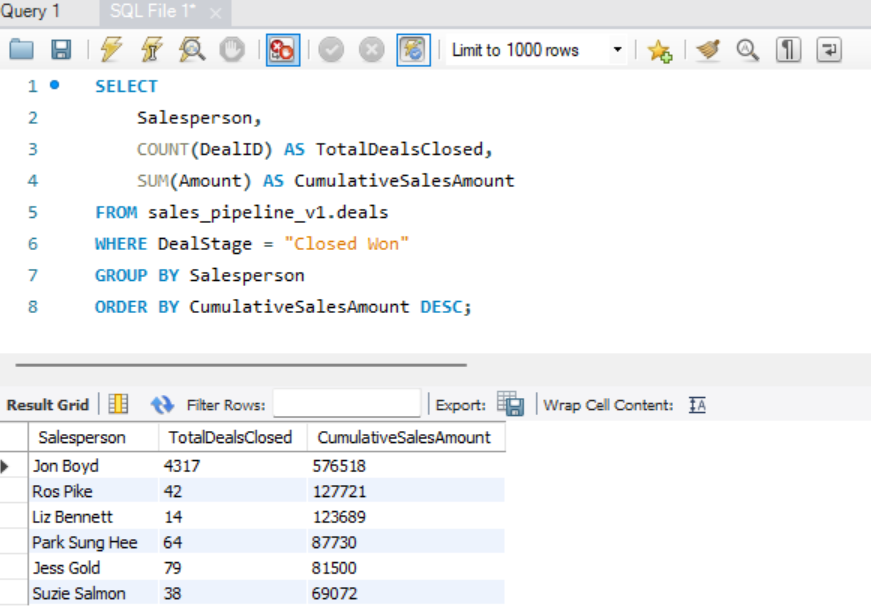
This query selects the salesperson, calculates the total number of deals closed (TotalDealsClosed), and the cumulative sales amount (CumulativeSalesAmount) for each salesperson from the Deals table. It then groups the results by salesperson and orders them in descending order based on cumulative sales amounts.
4. Deal Age Analysis: Understanding the average age of deals in different stages was crucial for gauging pipeline efficiency. SQL allowed me to calculate the average time a deal spent in the “Negotiation” stage, shedding light on potential bottlenecks.
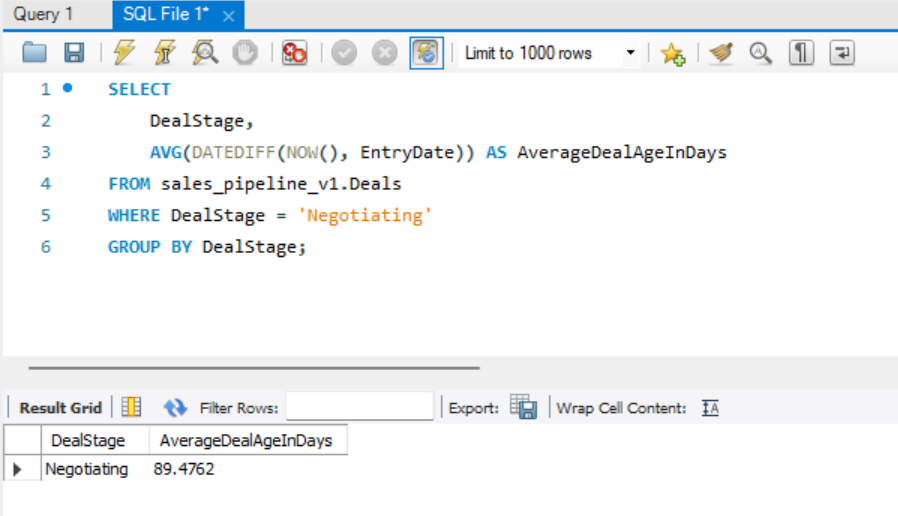
This query calculates the average age of deals in the “Negotiation” stage by subtracting the EntryDate from the current date (NOW()). It then groups the results by the deal stage.
Conclusion: This SQL project showcased the power of data analysis in dissecting the sales pipeline. The ability to write targeted queries enabled me to extract meaningful insights for strategic decision-making. By presenting these findings, businesses can refine their approach, optimize processes, and ultimately drive success in their sales endeavors.